From Jupyter Notebooks to Production: MLOps Workshop at Tech Borås
On September 23, I ran the third workshop in the AI Lab series at University of Borås. This time we tackled the gap between experimentation and production: the “throw it over the fence” problem that kills ML projects. This post shows how to bridge that gap with MLOps practices and tools.

The Development Environment Problem
Most ML projects start in Jupyter notebooks. You load data, explore it, train a model, validate it, and call it done. This works for experimentation, but it creates a problem: the entire workflow lives on your laptop in a linear, manual process.
The typical data science workflow:
- Data Analysis - Explore and understand your dataset
- Preprocessing - Clean and transform data
- Model Training - Fit your model to the data
- Model Validation - Check if it actually works
- Model Handover - Hope someone can deploy it
Each step runs manually. No automation. No versioning. No way to reproduce results reliably. When your model performs well in validation, you face a question: how do you get this into production?
At a small company, one person handles everything from data analysis to deployment. The handover happens between different hats the same person wears.
At medium and large companies, data scientists build models but struggle to hand them over to engineering teams. The model that worked perfectly in a notebook fails in production, or worse, sits unused because deployment is too difficult.
MLOps practices built on CI/CD principles solve this by eliminating the handover entirely. Instead of passing artifacts between teams or roles, you build automated pipelines that move code from experimentation to production. The same pipeline that trains your model also deploys it.
The “Throw Over the Fence” Anti-Pattern
When organizations try to scale their ML work, they hit a wall. Literally.

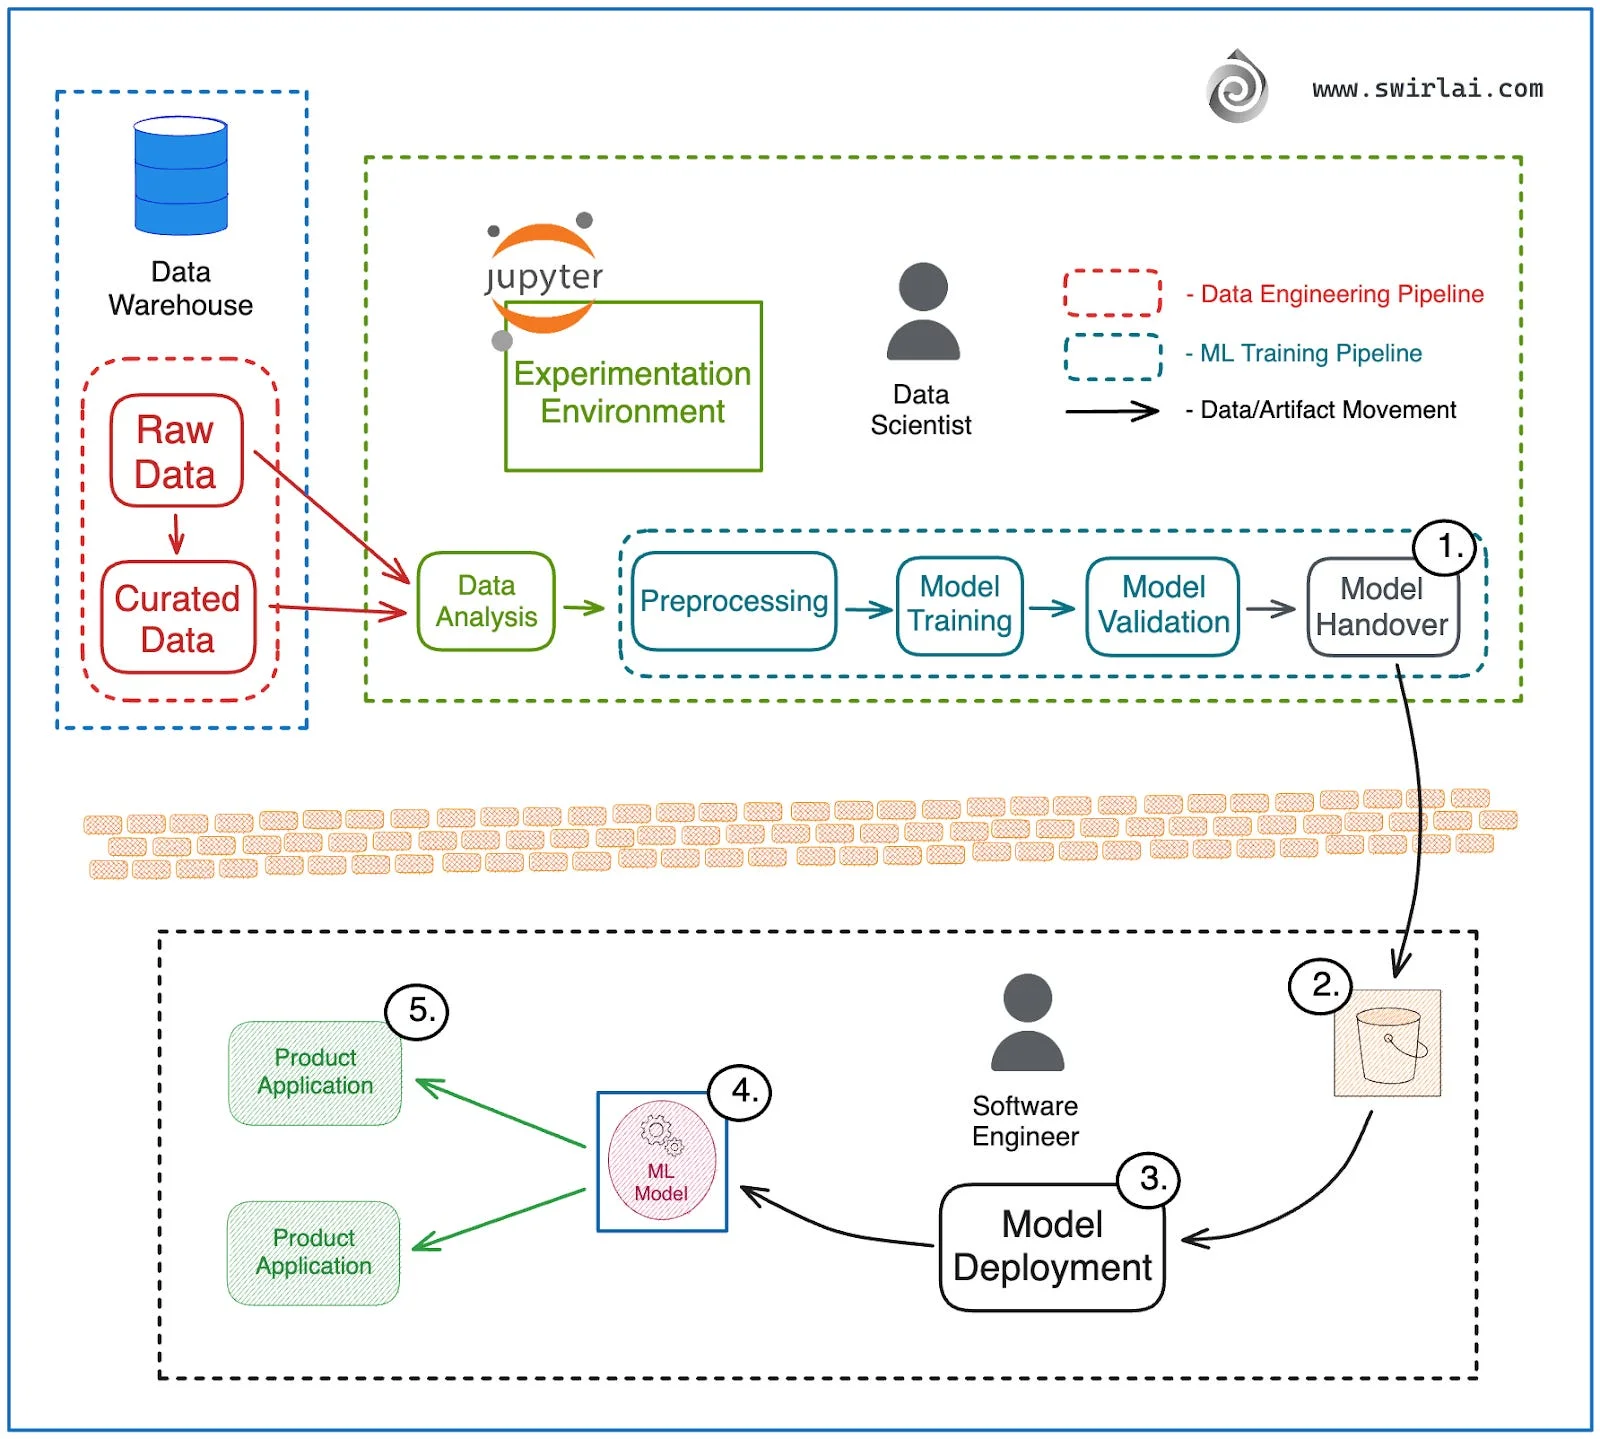
Look at the diagram above. On the left, the data scientist works in Jupyter, connected to the data warehouse. They analyze data, preprocess it, train a model, validate it. At the end of this pipeline sits Model Handover (step 1).
Then comes the wall. The brick wall in the middle represents organizational separation. The model artifact gets dumped into a bucket (step 2) and passed to the other side. No training context. No preprocessing code. No validation metrics. Just a pickled model file and hope.
On the right side, the software engineer receives this artifact (step 3). They attempt deployment (step 4), wrap it in a container, and expose it to product applications (step 5). Then reality hits.
The model that achieved 95% accuracy in the notebook gets 60% in production. Why?
- Different data distributions: Training used last month’s data, production sees today’s data
- Missing preprocessing: The notebook had 10 cells of data cleaning that never got documented
- Dependency mismatches: Model trained with scikit-learn 1.4, production runs 1.0
- No monitoring: When accuracy drops, nobody notices for weeks
This workflow breaks because it treats model development and deployment as separate problems. The data scientist optimizes for accuracy in experiments. The engineer optimizes for reliability in production. These goals conflict when there’s a wall between them.
Documentation doesn’t fix this. READMEs get outdated. Comments get ignored. What you need is shared infrastructure that both roles interact with during their work.
The MLOps Solution: Production Architecture
The solution replaces the wall with shared infrastructure. Instead of two isolated environments, you build automated pipelines that connect data, training, and deployment.

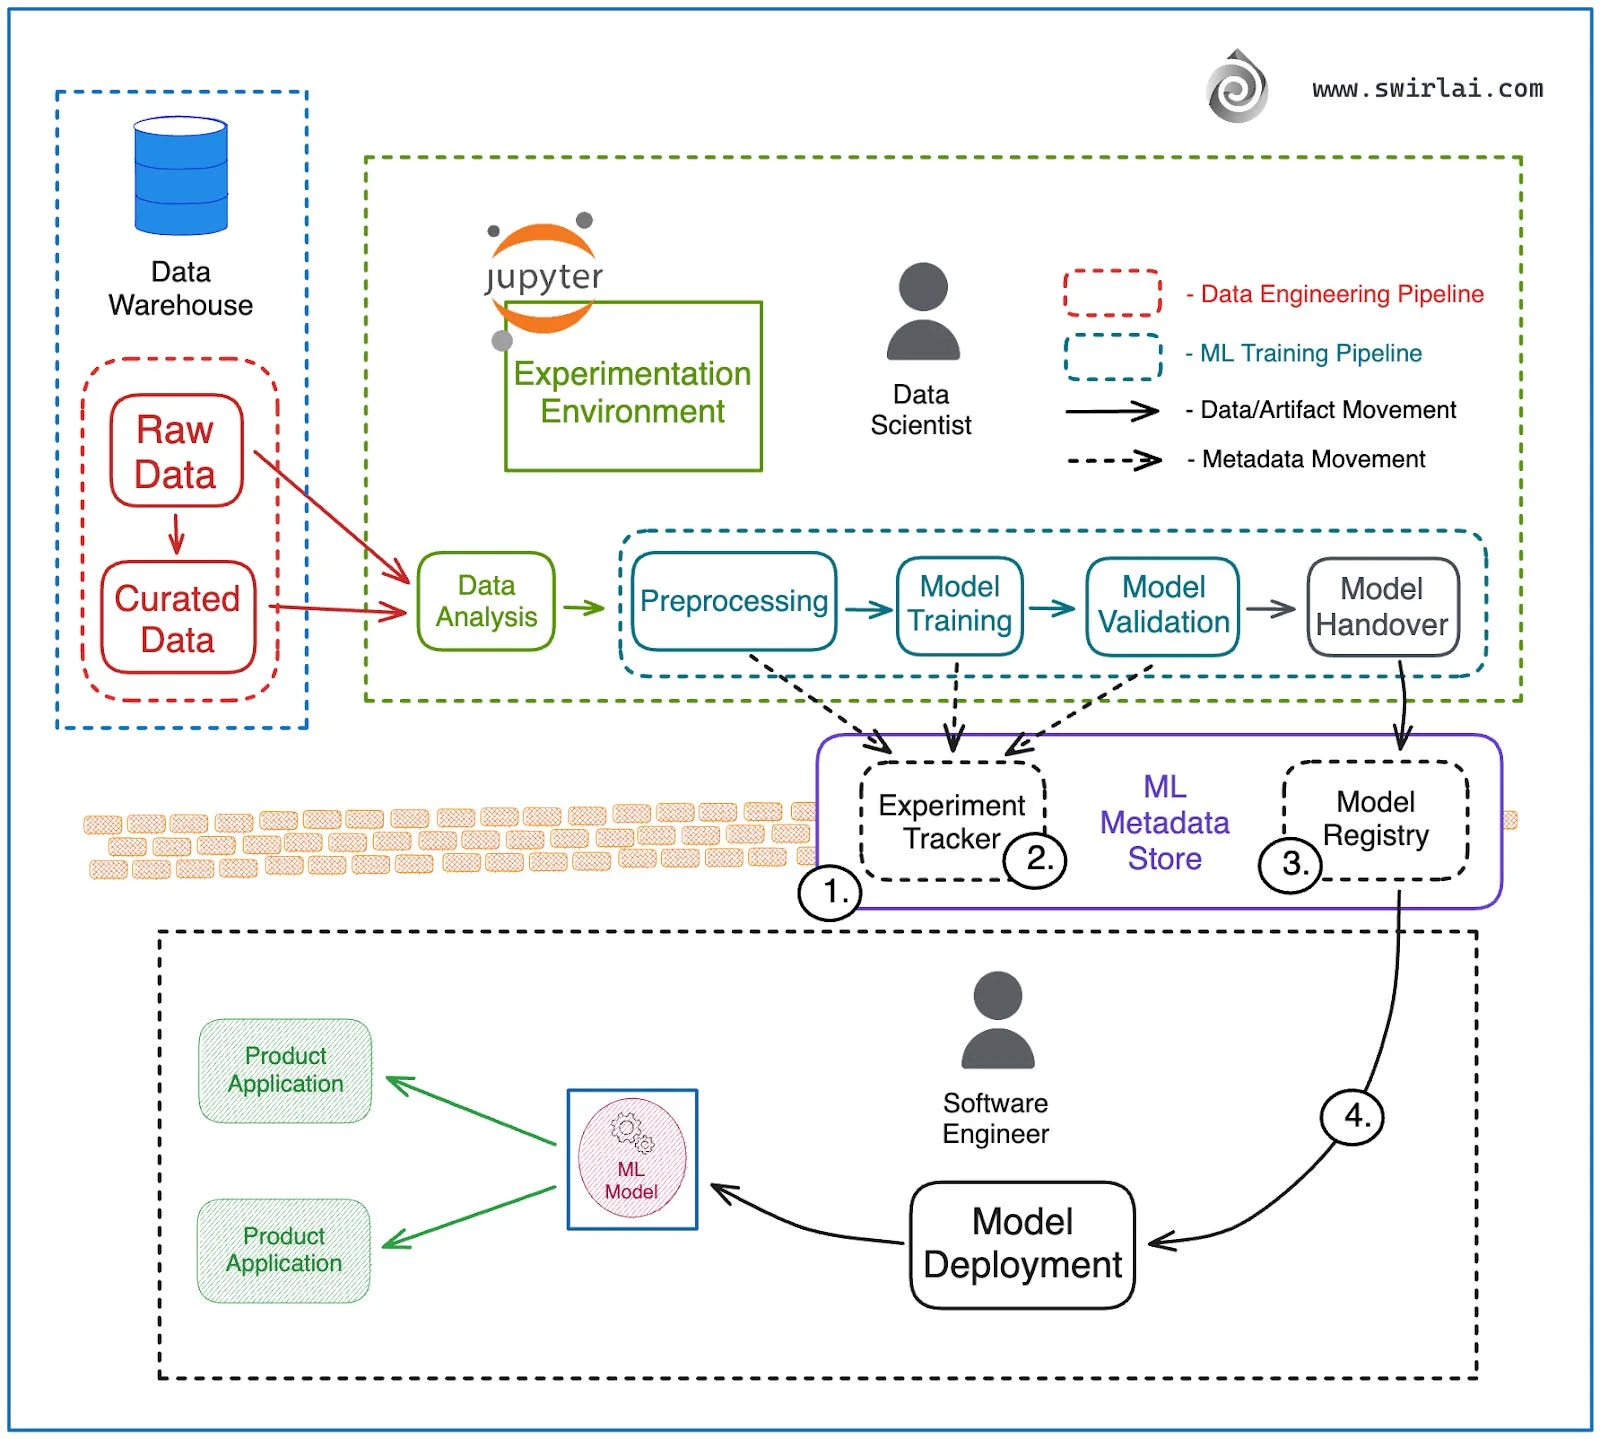
The diagram shows a production ML environment. Three automated pipelines replace manual handoffs: Data Engineering (warehouse to curated data), ML Training (preprocessing through validation), and Deployment (registry to production).
At the center sits a metadata hub with three components:
- Experiment Tracker: Logs metrics and parameters from every training run
- ML Metadata Store: Tracks data lineage and artifact relationships
- Model Registry: Stores versioned models ready for deployment
An orchestrator like Airflow runs these pipelines on schedules or triggers, creating a Continuous Training loop where models retrain automatically as data changes.
The wall is gone. Both data scientists and engineers interact with the same registry and metadata store. The model that gets deployed is the exact model that was validated, with full lineage tracking.
Building the Pipeline: MLflow + Airflow
The workshop put theory into practice. Attendees built a complete MLOps pipeline using MLflow for tracking and Airflow for orchestration, running locally on their laptops.

The tech stack:
- MLflow: Experiment tracking, metadata store, and model registry
- Airflow: Pipeline orchestration with a Directed Acyclic Graph (DAG)
- uv: Fast Python package manager for dependency management
The DAG Structure
The diagram shows five tasks that run in sequence and parallel:
- generate_data (PythonOperator): Simulates new data from a warehouse
- batch_predict (PythonOperator): Loads the registered model and makes predictions
- monitor_model (PythonOperator): Checks prediction quality and logs metrics to MLflow
- After monitoring, two tasks run in parallel:
- cleanup_old_artifacts (BashOperator): Removes old files
- generate_summary (PythonOperator): Creates performance reports
The DAG interacts with MLflow’s model registry to fetch the latest production model and logs monitoring metrics to the experiment tracker.
Setup and Installation
The full code is available at github.com/krjoha/ai-lab-mlops
. The workshop used uv, a fast Python package manager written in Rust that handles dependency resolution and virtual environments. It’s significantly faster than pip and creates reproducible environments. Both MLflow and Airflow run as local services: MLflow provides the web UI for experiment tracking and model registry at http://localhost:5000, while Airflow runs the scheduler and web interface for DAG management at http://localhost:8080.
| |
After starting Airflow, find the username and password in the terminal output or in airflow/simple_auth_manager_passwords.json.generated.
Training and Registering a Model
Run the training script to create the initial model:
| |
You can see the stored and versioned model in the MLflow UI at http://localhost:5000/#/experiments. After creating a model and storing it in the MLflow registry, you can go to the Airflow UI at http://localhost:8080 and run the prediction DAG/pipeline from there.
The workshop builds a sentiment classification model using scikit-learn’s Pipeline to chain a TF-IDF vectorizer with logistic regression. Here’s the core training logic (see tasks/train_model.py
for full implementation):
| |
The key insight: mlflow.register_model() puts the trained model into a central registry where downstream pipelines can load it by name, not by file path. This separation between training and deployment means data scientists can register multiple model versions, and engineers can load the latest version without touching training code.
Model Monitoring
The monitoring task analyzes prediction trends over time by querying MLflow’s experiment tracking. Instead of checking a single accuracy number, it looks at patterns across multiple DAG runs to detect degradation early (see tasks/monitor_model.py
for full implementation):
| |
This creates a feedback loop: predictions generate metrics, monitoring analyzes those metrics across time, and alerts trigger when patterns indicate problems. All tracked in MLflow.
The workshop put MLOps theory into practice. Attendees built complete pipelines with MLflow tracking, Airflow orchestration, and automated monitoring running on their own laptops. The same architecture that handled sentiment classification in the workshop scales to fraud detection, recommendation systems, or demand forecasting in production.
What makes this approach work is eliminating the handoff. When data scientists and engineers both interact with a shared model registry, the “throw it over the fence” problem disappears. Automated pipelines catch issues during development, not in production. Monitoring tracks trends across runs instead of waiting for users to report problems.
MLOps & AI Consulting in Borås
This was the third workshop in the AI Lab series at University of Borås, focused on practical MLOps for developers and engineers. I provide AI and data engineering consulting for businesses in Borås and throughout Sweden. If you need help implementing MLOps infrastructure, building ML pipelines, or moving models from experimentation to production, reach out.
